

Ever heard the term “Giniä” floating around? It might sound like some super new, super complicated economic jargon, but let’s be real: at its core, it’s about something that’s been shaping our world for over a hundred years. We’re talking about the Gini coefficient. Think of it as a really powerful snapshot of how money and stuff are divvied up. It’s like a crucial thermometer telling us how fair (or unfair!) the sharing of resources is among people. And trust me, this isn’t some dusty academic idea; understanding Giniä is absolutely key if you want to get a real handle on how economic fairness works and how it shakes up societies everywhere.
If you’re just starting to dive into the wild world of economic data, wrapping your head around Giniä is seriously a game-changer. It’s your first big step to understanding the whole inequality picture. And its impact? Oh, it runs deep! We’re talking policy debates, social chats – especially in places like the United Kingdom, where economic differences are a pretty big deal. By digging into this super important number, we can really start to see what makes wealth gaps stick around or, even better, what helps close them. It’s basically an essential tool for all of us, whether you’re just a curious citizen or dreaming of shaping policy one day.
Understanding the Gini Coefficient: The Core Concepts
What Exactly is the Gini Coefficient? A Beginner-Friendly Definition
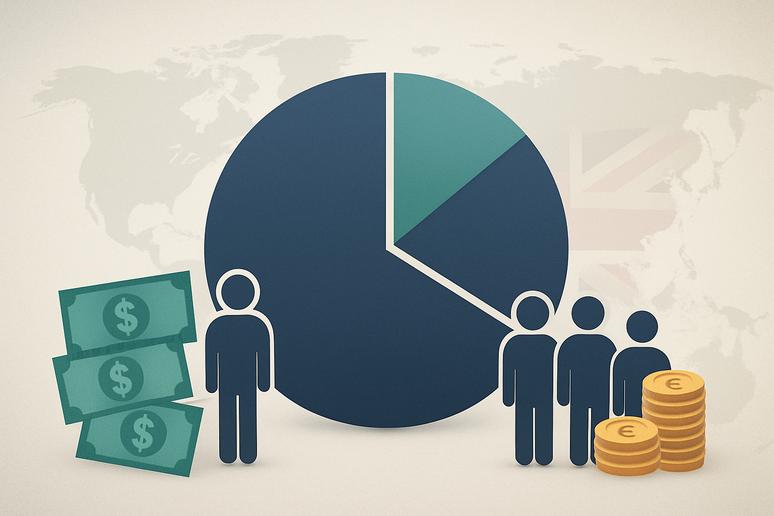
So, what exactly is this Gini coefficient thing? Well, in simple terms, it’s a number that shows us just how much inequality there is in how things are distributed – usually income or wealth. Picture a simple scale, from 0 to 1. These two ends represent totally different economic worlds, right?
- A Gini of 0? That’s perfect equality! Imagine everyone in a group having the exact same slice of the pie – identical shares of all the income or wealth. Pretty neat, huh? (Our World in Data backs this up!).
- But flip that coin: A Gini of 1 (or 100% if you’re talking percentages) means perfect inequality. That’s where one single person or group hogs absolutely everything, leaving zero for everyone else. Yikes! (Corporate Finance Institute explains this stark reality).
This number is super important because it helps us figure out how income and wealth are spread out among a country’s people. It essentially measures how far off a country is from that ‘perfectly equal pie’ scenario. This makes it super easy to compare how fair things are in different places or even how things have changed over time. Basically, the closer a country’s Gini coefficient is to 0, the more fairly its stuff is shared. But if that number creeps up, it means more wealth or income is ending up in fewer pockets.
The Origins of Giniä: A Brief History
Okay, so who cooked up this clever idea? Well, we can thank an Italian statistician named Corrado Gini. He came up with this whole concept back in 1912! That means ‘Giniä’ has been a fundamental part of economic analysis for over a century – pretty wild, right? Gini wanted a solid, no-nonsense way to measure income and wealth inequality, something clear and measurable to truly understand how unfair things could be in society. His brilliant work basically set the standard for objectively measuring who has what, moving us past just guessing or sharing stories, to a number we could actually use and compare everywhere.
When Gini came up with his coefficient, it was a huge deal for economists and policymakers. Before it, talking about wealth distribution was mostly just a bunch of qualitative chatter – no real standard way to compare different countries or see how things changed. But Gini’s simple, single number? It totally changed the game, giving us a much more scientific way to see how resources are shared. It highlighted the really big gaps and gave us a starting point to see if policies were actually working to fix things.
Why Giniä Matters: Its Role in Society and Economics
Measuring Income and Wealth Inequality: Distinguishing Key Differences
The Gini coefficient is super versatile – it can tell us about both income and wealth inequality. But hold on, it’s really important to know the difference between the two!
- Income inequality is all about how earnings (think salaries, wages, investments) are spread out over a specific time, usually a year. It’s about what you make.
- Wealth inequality, though, is about the unequal distribution of everything you’ve accumulated – your house, your savings, your investments, at a single moment.
Take the UK, for example. Its wealth distribution shows some pretty staggering disparity, with a wealth Gini coefficient hitting 74.6%! (That’s according to the Equality Trust). Whoa.
Here’s why understanding this difference is so crucial: while making less money can definitely lead to less wealth over time, it’s not always a direct one-to-one thing. A country might have pretty stable income for everyone, but still have a huge wealth gap because of things like history, inheritance, or how investments grow. So, looking at the Gini coefficient for both income and wealth in the UK gives us totally different, but equally important, clues about the nation’s economic well-being and fairness. This then helps guide policymakers to tackle the right kind of inequality with the right solutions.
Global Comparisons: Giniä’s Insights into International Disparity
What’s super cool about Giniä is how it lets us compare economic equality across the globe! Because it uses a standard scale, countries can easily see where they stand in terms of how income and wealth are distributed, compared to everyone else. Think about it: countries with really strong social welfare programs usually have lower Gini coefficients – meaning more equality. On the flip side, some fast-growing economies or nations without strong safety nets might have higher coefficients, showing much bigger differences.
These global comparisons, often put together by big players like the World Bank and the OECD, give us a vital benchmark for national policy talks. For instance, the UK’s Gini coefficient for disposable income was around 33.1 in 2023. You can then stack that number against others worldwide to really see where the UK sits on the global scale of economic fairness. This kind of comparison is gold for policymakers – it helps them spot what’s working well elsewhere and where the UK might need to shake things up. It really deepens our understanding of what makes global economic disparity better or worse.
Giniä in the United Kingdom: A National Perspective
Current State of Inequality: What the UK’s Gini Coefficient Reveals
Let’s zoom in on the UK for a bit. Looking at the Gini coefficient here gives us some really useful insights into the nation’s economic picture and the constant battle against inequality. Recent numbers show the UK has a moderate level of income inequality. Specifically, the Gini coefficient for disposable income was 33.1 in 2023. Now, while that number still points to some unevenness, it’s actually a tiny bit lower than in previous years. So, maybe, just maybe, things are getting a little fairer on the income front.
So, why do they care so much about this particular measure? Well, governmental bodies and research groups, like the Office for National Statistics (ONS), keep a very close eye on it. It helps them see if economic policies and welfare programs are actually doing their job. These figures really help us understand how different income groups are doing and can flag important trends – like whether the gap between the richest and poorest is getting bigger or smaller. Honestly, if you want to have a real, productive chat about the UK’s economic future and how well society sticks together, you need to understand where Giniä stands right now.
Impact on Policy and Society: How Giniä Influences UK Decisions
This isn’t just some abstract number; the Gini coefficient actually plays a huge role in shaping UK government and economic policy. Its ups and downs, its general direction – all of it provides crucial data that fuels debates about social justice, economic growth, and how to fight poverty. When the Gini coefficient goes up, showing more inequality, it often kickstarts conversations about things like progressive taxation, beefing up social safety nets, and making public services better, all to try and spread wealth and opportunities more fairly.
On the flip side, if Giniä stays steady or even dips, that could mean the current policies are actually doing a good job of narrowing those gaps. For us, as a society, getting a grip on this economic metric is super important because it directly links to things like how easy it is to move up in life, getting good education and healthcare, and simply having a decent quality of life. So, the Gini coefficient isn’t just a number on a chart; it’s a powerful guide for national conversations and directly influences decisions that deeply impact millions of lives right across the UK.
Beyond the Basics: Nuances and Limitations of Giniä
What Giniä Doesn’t Tell You: Important Considerations
Okay, so while the Gini coefficient is an awesome way to measure income inequality, here’s the catch: it’s super important to know what it doesn’t tell you. You need to understand its limitations if you want to get the full picture of economic disparity. A big thing to remember is that Giniä won’t tell you about absolute income levels or how good life actually is in a country. Get this: two countries could have the exact same Gini coefficient, but one might have really high average incomes and fantastic public services, while the other is battling widespread poverty. The coefficient literally only describes how things are distributed, not how much stuff there actually is overall.
Plus, the Gini coefficient totally misses other important details like a population’s age structure or how many students there are, and it doesn’t factor in non-money benefits and services. A country with tons of older folks or a lot of students might naturally have a higher Gini because incomes vary widely in those groups, but it doesn’t necessarily mean everyone’s in severe hardship. So, just looking at Giniä by itself can give you an incomplete story. You really need to look at it along with other clues – things like poverty rates, how easy it is to get education, and healthcare data – to truly understand inequality.
Addressing Misconceptions: Clarifying the Term “Giniä”
One quick thing to clear up: let’s talk about the term “Giniä” itself. While we’re using it here as a kind of trendy, shorthand way to talk about the Gini coefficient, it’s super important to remember that its main (and pretty much only) use in economics is to refer to Corrado Gini’s statistical measure of inequality. You won’t find any other widely accepted cultural or alternative meanings for “Giniä” that stray from its economic definition.
So, next time you hear “Giniä,” especially in chats about economics, policy, or how society shares its stuff, just know it’s a direct shout-out to the Gini coefficient. Getting this straight helps us avoid confusion and keeps our discussions focused on its well-established job: being a crucial economic indicator for measuring income and wealth distribution. Any other way of using the term would be pretty unconventional and could totally mess up our understanding of vital economic data.
Conclusion
So, there you have it. “Giniä” – or really, the Gini coefficient – is an absolutely essential tool for making sense of and tackling the tricky world of income and wealth inequality. From its beginnings as a rock-solid statistical measure dreamed up by Corrado Gini, it’s become this globally recognized number that gives us a super clear, quantitative look at how fairly resources are shared among people. Its straightforward scale, going from perfect equality all the way to perfect inequality, offers such an intuitive way to gauge economic differences and watch them change over time.
And for economic analysis and policymaking here in the UK? Well, the importance of Giniä can’t be stressed enough! By looking at the Gini coefficient figures for the UK, policymakers, economists, and even us regular citizens get crucial insights into national trends in income and wealth distribution. This understanding isn’t just academic; it fuels really important debates about social justice, how our economy grows, and how we can fight poverty. Basically, the Gini coefficient is a cornerstone for making smart decisions. The more you know about this critical economic indicator, the better equipped you are to jump into those conversations that are shaping the future of economic fairness and all our well-being.